

 Randy Lindberg
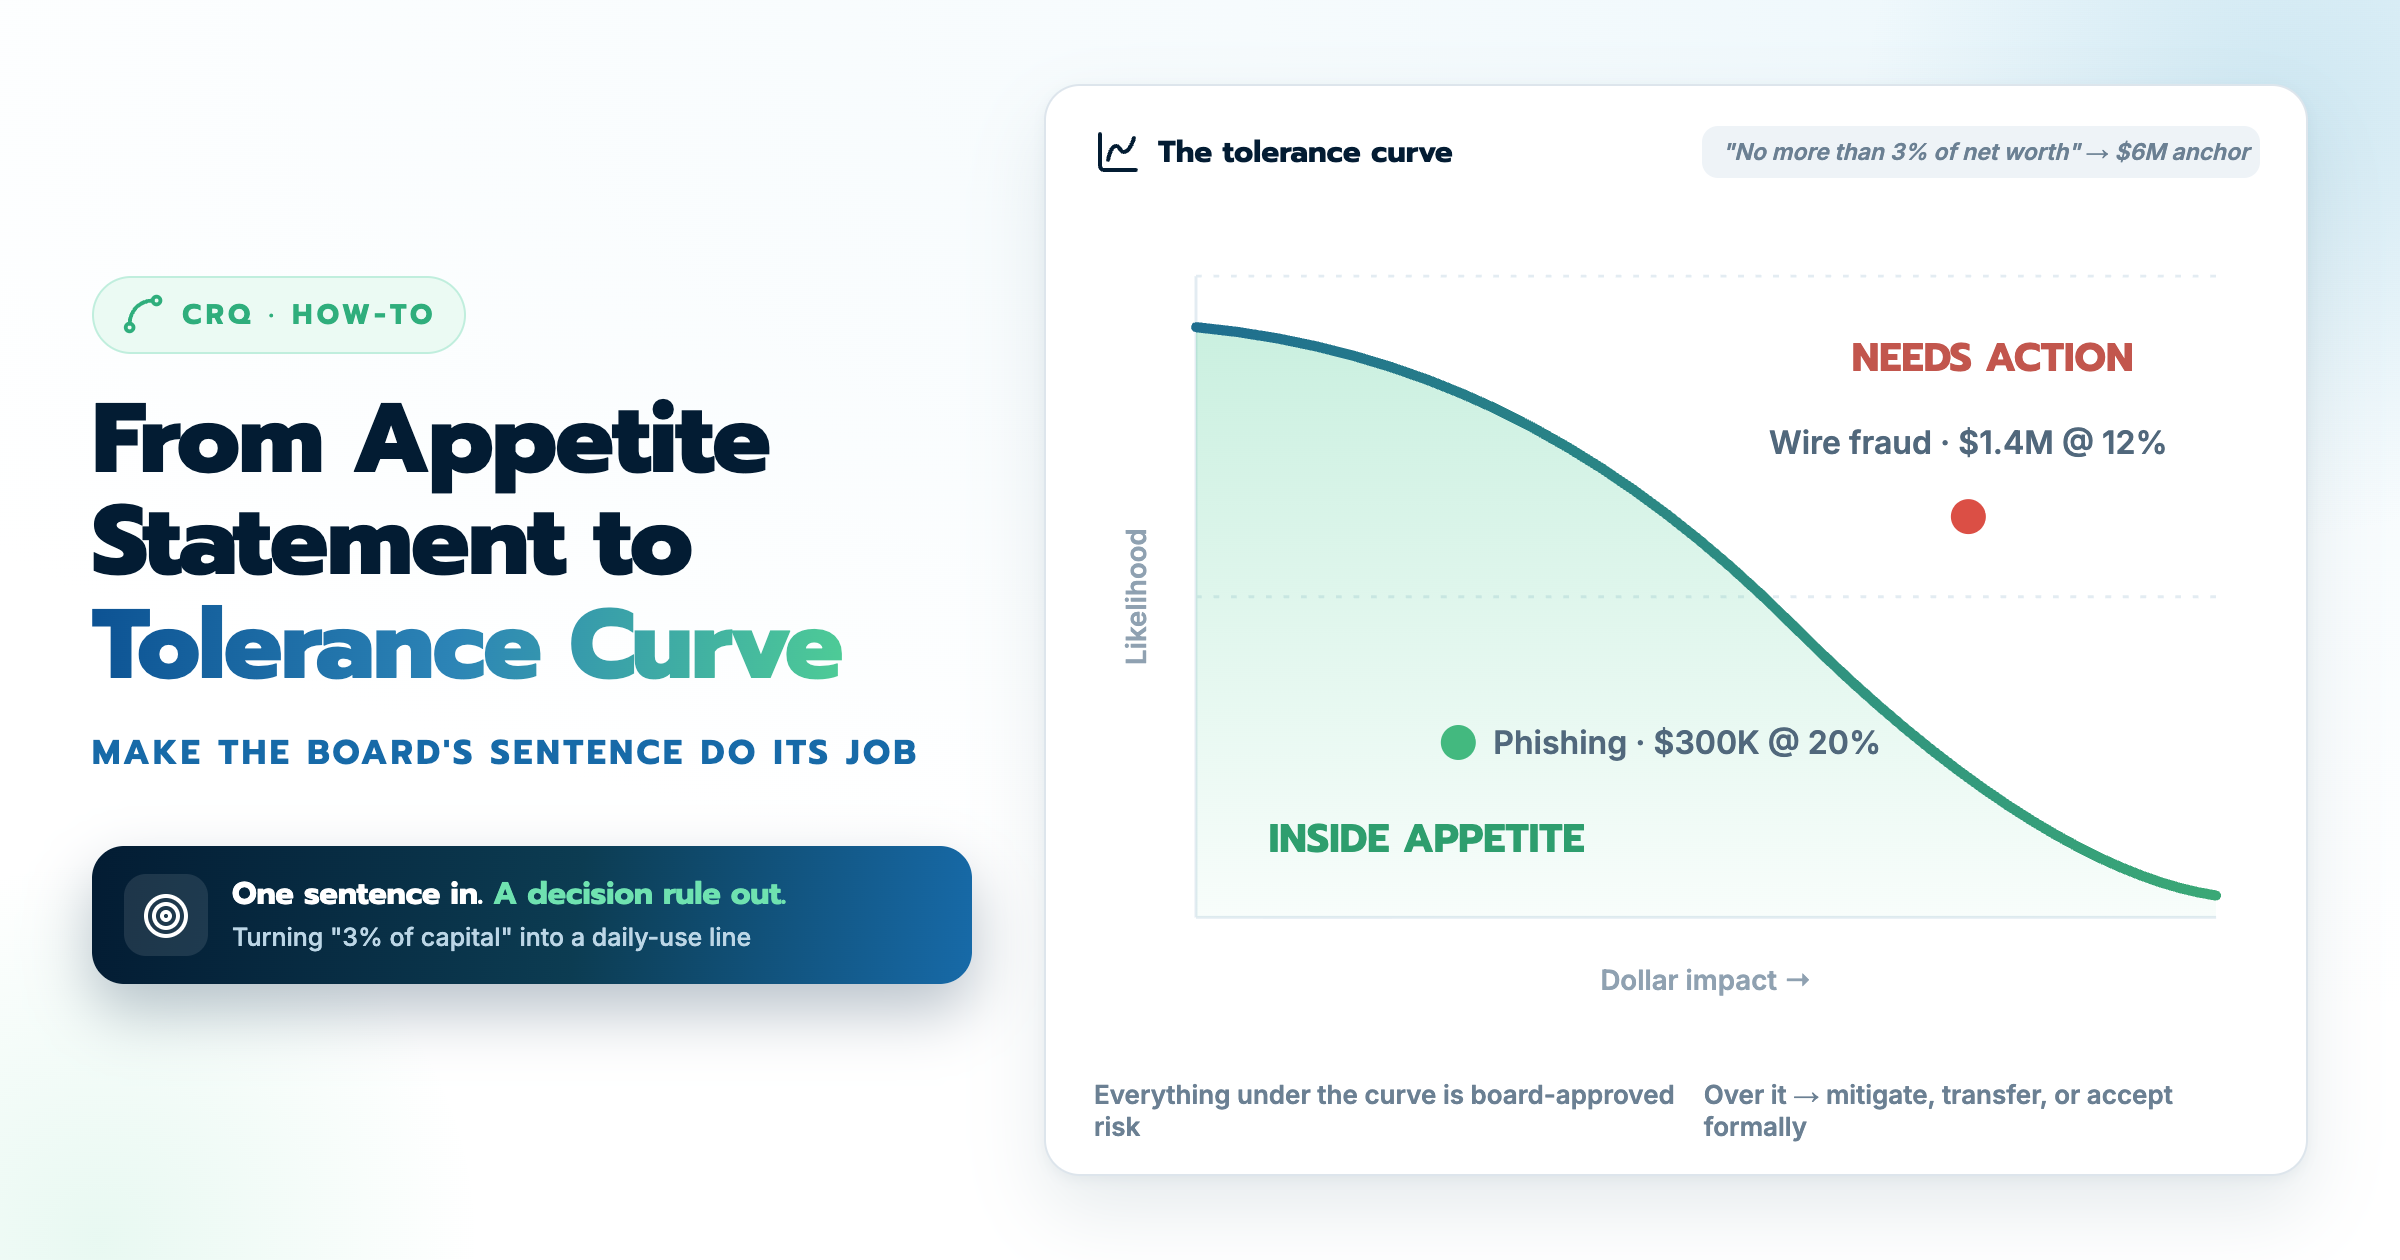
Somewhere in your board policy there is a sentence like this: "The credit union will not accept cyber risk exceeding 3 percent of net worth." The board approved it, the examiner saw it, and it has influenced exactly zero security decisions since. That is not your board's fault. An appetite statement is a sentence, and you cannot compare a sentence to a risk assessment. This post shows you how to turn that sentence into a risk tolerance curve, with the actual math, so the statement starts doing its job.
Appetite vs tolerance: the missing translation
Risk appetite is the board's philosophical position: how much risk, in total, the institution is willing to carry. Risk tolerance is the operational version: the specific line that tells you whether any given system's risk is acceptable. Most institutions have the first and skip the second, which leaves the security team holding a philosophy and a spreadsheet with no way to connect them.
The connection is a curve, because risk is not one number. A $6 million loss with a 1 percent annual chance and a $50,000 loss with a 50 percent annual chance are different animals, and your board would tolerate them differently. The tolerance curve draws the line across every combination of likelihood and dollar impact at once: everything under the curve is inside appetite, everything over it needs action. It is the Goldilocks instrument of a security program. Too far under the curve and you are overspending on security; over it and you are carrying risk the board never agreed to. The job is to sit just right against a line the board actually approved.
An Examiner Approved Cyber Risk Model
Check out the Cyber Risk Management Model that examiners reference below


The worked example
Take that 3 percent statement at a credit union with $200 million in assets.
Step 1: Convert the appetite to dollars. Three percent of $200 million is $6 million. That is the maximum single-event loss the board has said it can stomach.
Step 2: Anchor it to a likelihood. A $6 million tolerance means nothing until you say how likely. The convention that works: treat the appetite ceiling as the loss you would accept at a 1 percent annual likelihood, roughly a once-in-a-hundred-years event. So the first point on your curve is $6 million at 1 percent.
Step 3: Build the rest of the curve. As likelihood rises, tolerable loss falls. If the institution accepts $6 million at 1 percent, it might accept around $600,000 at 10 percent and only tens of thousands for the kinds of events expected most years. Plot those points and connect them. The shape slopes down and to the right: rare events earn a high ceiling, frequent events a low one.
Step 4: Take the curve to the board. This is the difference between a statement and a mandate. Show the board the curve their own sentence implies and let them react. Maybe they look at $6 million and flinch, and the appetite statement gets revised down. Good. That flinch is the board actually setting risk appetite for the first time, instead of approving a sentence nobody tested. Either way, you walk out with a line the board has seen, understood, and owned.
Step 5: Plot your systems against it. Now run your risk assessment and place every system's quantified risk, its likelihood and dollar impact, on the same chart. In one picture you can see which systems sit inside tolerance and which have crossed the line. The core processor sitting above the curve is a board conversation. The marketing site sitting far below it is a place you might be overcontrolled.
Notice what just happened to prioritization. Without the curve, "what should we fix first" is a debate. With it, the answer is whatever sits furthest above the line, and the justification is the board's own approved appetite. You are no longer defending your judgment. You are executing theirs.
What this changes in practice
Three conversations get transformed by this one artifact.
The budget ask. Instead of "we need $50,000 for this control because the risk is high," it becomes "this system exceeds our board-approved tolerance by $400,000 in expected annual loss, and this $50,000 control brings it back under the line." One of those requests gets tabled. The other gets approved, because it is not really a request; it is the board's policy asking for its own enforcement.
The exam. Examiners increasingly ask not just whether you assess risk but how you decide what is acceptable. A tolerance curve tied to a board-approved appetite statement is the cleanest possible answer, because the acceptance criteria are documented, quantified, and owned at the right level.
The quiet quarter. Risk drifts. A system takes on a new data feed, a control decays, a vendor changes scope. With a curve in place, drift is detectable: a system that was under the line last quarter is over it now, and that crossing is a trigger rather than a surprise.
This is also exactly where a platform earns its place. In Rivial, the tolerance curve lives alongside the quantified assessment, every system's Monte Carlo result plots against it automatically, and alerts fire when a system crosses the line. The board report writes itself from the same data: here is our appetite, here is where every system sits against it, in dollars. No translation layer between policy and program.
If you do not have an appetite statement yet
Run the same play in reverse. Draft the curve first, using the 3-percent-of-net-worth convention as a starting point, and bring it to the board as a proposal. It is far easier for a board to react to a concrete curve than to author a statement from nothing, and the discussion it provokes is the most useful risk conversation most boards have all year.
Put your systems on the curve
The fastest way to make this real is to see your own systems plotted against a tolerance line. Our free cyber risk assessment quantifies five of your critical systems in dollars and shows you exactly where they sit against a curve built from your institution's numbers, and we guarantee it identifies at least $100,000 in risk reduction. Two hours of your team's time, the report is yours, no sales call required.
Here are the key takeaways from this blog:
- A statement is not a tool: an appetite sentence in a policy binder cannot evaluate a single risk until it becomes a tolerance curve.
- The math is simple: percent of net worth gives you dollars, a 1 percent likelihood anchor gives you the first point, and the curve slopes down as likelihood rises.
- Board ownership is the point: showing the board the curve their sentence implies forces a real appetite decision and hands you their mandate.
- Prioritization stops being a debate: whatever sits furthest above the board-approved line goes first, and budget asks become enforcement of the board's own policy.
An Examiner Approved Cyber Risk Model
Check out the Cyber Risk Management Model that examiners reference below